Using sports to make sense of motion in a line


A few years ago, the two of us were co-teaching science to Grade VIII students. It was close to the end of the academic year and we were discussing our teaching plan for the next year. Sreeja, who had been teaching in the school for several years, shared her experience that even students who otherwise liked to read found it difficult to connect with the science textbook. Moreover, they found textbook chapters on physics, like those on motion, especially dry and uninteresting.
We tried to address this challenge in teaching concepts related to motion in one line (see Box 1). Although we share our experience in a continuous manner, our attempt took two weeks (we had three classes per week of 40 minutes each). While we had a tentative plan for each class, responses and questions from our students greatly helped us fine-tune our plans according to their understanding of concepts. We discuss some of these student responses and share how they sometimes helped us take things forward. While looking at our notes and writing about this experience, we were able to reflect on our pedagogical approach. Perhaps this article could be seen as a suggested teaching sequence that other teachers can adapt and modify according to need and relevance (see Teacher’s Guide: Suggestions for Teaching Concepts Related to Linear Motion).
Box 1. One-dimensional motion in the middle stage science curriculum:
According to the National Curriculum Framework for School Education (NCF-SE) 2023, science education at the middle stage is expected to help students develop the competency to describe: “One-dimensional motion (uniform, non-uniform, horizontal, and vertical) using physical measurements (position, speed, and changes in speed) through mathematical and diagrammatic representations”.1
To meet this curricular goal, the concept of motion is first introduced in Chapter 5 (‘Measurement of Length and Motion’) of the Grade VI science textbook (NCERT, 2024- 2025).2 This chapter also discusses the measurement of length and its standard unit (metre). The concepts of time and speed are first introduced in Chapter 9 (‘Motion and Time’) of the Grade VII science textbook (NCERT, 2024-2025).3
Introducing Usain Bolt
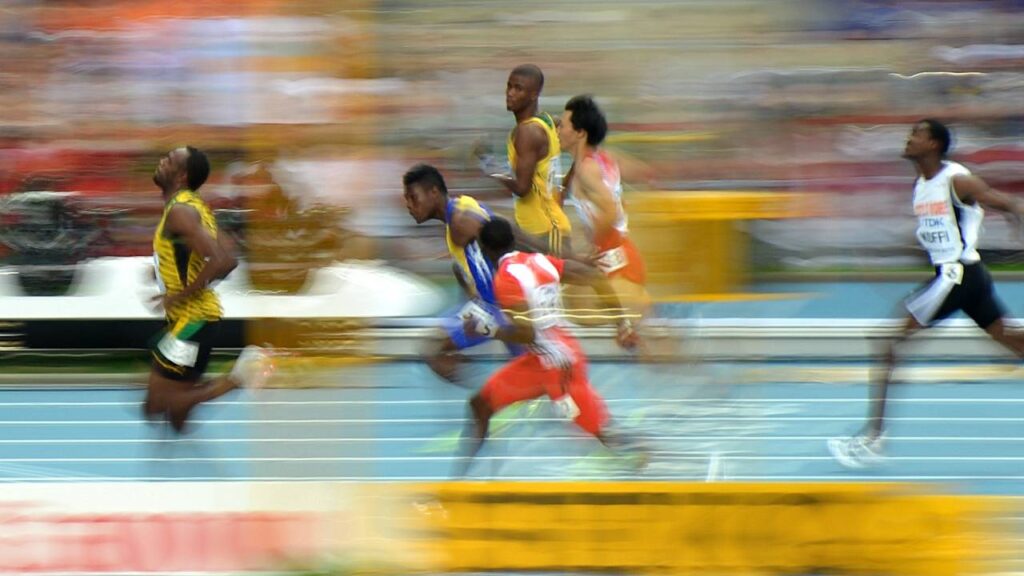
In a book titled ‘Infinite Powers’, Steven Strogatz, the mathematician-writer, uses calculus to analyse the Jamaican athlete Usain Bolt’s record-breaking 100-metre sprint in the 2008 Beijing Olympics.4 While thinking about how to get our students interested in motion, we came across this excerpt from the book. Since many of our students liked sports, we thought this was a context they would be able to connect with. For this reason, we started our exploration of motion by playing a video of Bolt’s 100-metre sprint in the 2009 Berlin World Championships in Athletics.5 It was in this event that Bolt set the current world record for sprinting.
The athletes in this sprint ran so impressively that watching them left all of us—children and adults—feeling amazed and excited. We watched the video a couple of times and were in awe of Bolt’s feat. This is how we captured his feat on the class board:
100 metres → 9.58 seconds
A student remarked that this meant Bolt had taken less than a second to cover 10 metres. We asked why she thought so. She responded that if Bolt took a second to cover every 10 metres of the track, it was only a matter of adding up 1 second for each of these lengths and getting 10 seconds for the complete track. As she explained her reasoning, we drew a straight track on the board with 10-metre markings (see Fig. 1). Since Bolt took less than 10 seconds to finish the race, the student continued, he must have covered 10 metres in less than a second. We let the students think about this for some time and rephrased her reasoning in terms of a direct proportion:
10 metres in 1 second
100 metres in ? seconds
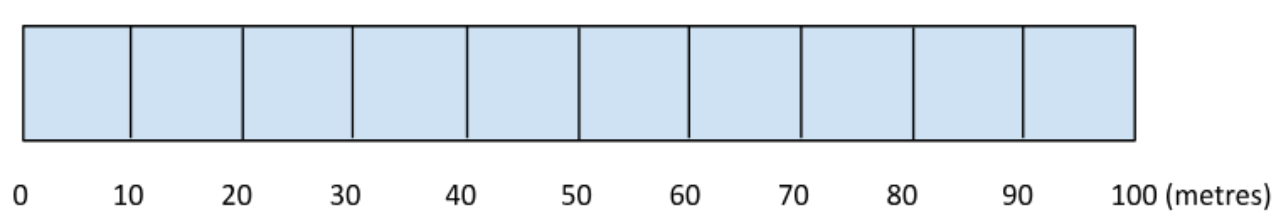
To help the students develop a sense of distance, we wondered aloud how long 10 metres was. To relate this to a distance familiar to them, we asked the students to measure the distance from the chalkboard to the opposite wall with a metre stick. Two of the students volunteered to make this measurement. We suggested that they mark each metre with chalk. This distance turned out to be 7 metres. We took a few minutes to visualise Bolt going from the board to much beyond the wall in a second.
“Can we run like Usain Bolt?”
Feeling very inspired by Bolt’s video, two of our students claimed that they too could run very fast. Their classmates caught on to their excitement and started encouraging them to race. We quickly discussed this idea amongst ourselves. Both of us felt that it could be an opportunity to deepen their sense of distance and to introduce them to the measurement of time. So we decided to go ahead with their plan.
We gave the students a 5-metre metal measuring tape and asked them to measure the distance along the dirt road outside the school gate. Their measurement showed that we did not have enough space for a 100-metre race, but there was space for a 50-metre one. We wanted to compare the speeds of the two students with that of Bolt. So we asked our students to suppose that Bolt runs half the distance (50 metres) of the sprint in half the time (approximately 4.8 seconds or almost 5 seconds). We also asked the class to guess how much time their classmates might take to run 50 metres. Many of the students felt that their classmates would take double Bolt’s time (or 10 seconds). Some teasingly said that they may take thrice that much time (or 15 seconds).
We invited our students to work out the details of the race. The students used a stick to mark a ‘start’ line and ‘finish’ line in the soil. One group of students stood at the start line and another at the finish line. We suggested that they use the stopwatch in one of our mobile phones to time the race. But, after that, we left it to them to discover the problems and precautions needed to make this measurement accurately. We only suggested things and pointed out issues as and when necessary, as too many instructions at the beginning would have been out of context for the students.
As expected, our students struggled with coordinating and recording the start and end times on the stopwatch. After some false starts by the runners and the students handling the stopwatch, we figured out a system that seemed to work better for us. One student decided to stand near the start line and another at the finish line. To start the race, the student at the start line would do a countdown from 10 to 0 in a loud voice and drop a handkerchief at the count of 0. At this cue, the student at the finish line would start the stopwatch. The two students practiced coordinating this sequence a few times before the actual race. The two runners ran the race with a lot of cheering from their classmates. It took one of them 8 seconds and the other 8.5 seconds to reach the finish line. Everyone applauded them.
Calculating speed
One of the expected learning outcomes for Grade VII science is that students learn to measure and calculate the speed of moving objects.6 But we anticipated that our students were only familiar with the idea of speed in an everyday and qualitative sense. So we went back to the class and wrote this down on the board:
50 m → 8 seconds
What is your friend’s speed?
Since none of the students responded to our question, we could see that they did not know how to calculate speed. So we asked them to compare their classmates’ sprints with Bolt’s. The students said it would have taken their classmates 16-17 s to finish the 100 m race. We said, “Okay, could you tell us how much distance they would cover in one second?” One of the students saw that this too was a problem of direct proportion and stated it on the board in these terms:
100 m in 16 s
? m in 1 s
We used a calculator to answer this question and asked the student to replace the question mark on the board with 6.25 metres. At this point, we introduced the students to the idea that the distance covered by a moving object in unit time was called speed (we meant ‘average speed’; however, we wanted to avoid introducing too many new terms to the students in one go).
We reiterated this by writing the average speed of their fastest classmate on the board: 6.25 metres per second or 6.25 m/s. To relate this number to something tangible, we explained that this value meant that their classmate would not cross the length of the classroom (7 metres) in a second.
Since we wanted to discuss other details of Usain Bolt’s sprint, we asked the students how much distance Bolt would cover in one second. One of the students had already reasoned out that it had to be more than 10 metres. The class was now able to calculate Bolt’s speed using the same logic of direct proportion.
Thinking further about speed
To help our students think further about how distance, time, and speed are related, we found the data for the time Bolt took to cover each 10 metre ‘split’ and wrote it down on the board (see Fig. 2a).7 Then we wrote these values next to the track on the board (see Fig. 2b). We asked our students if they could guess what reaction time meant. Some of them wondered if it was the time an athlete takes to react to the sound of the pistol shot that signals the start of the race. We confirmed this and restated it as the time interval between the pistol being fired and the athlete beginning to run.
We asked the students to observe the numbers on the track. Did they see any patterns? A couple of students observed that the numbers suggested that Bolt had speeded up. When asked to explain why they thought so, the students pointed out that as the race progressed, Bolt covered the same distance (10 metres) in lesser and lesser time. Another student remarked that Bolt had speeded up for the first 70 metres, but had run at an almost constant speed beyond that. We watched the video again to see if we could notice him speeding up. We could see the amount of effort that all the runners made immediately after starting off and in the earlier half of the race.
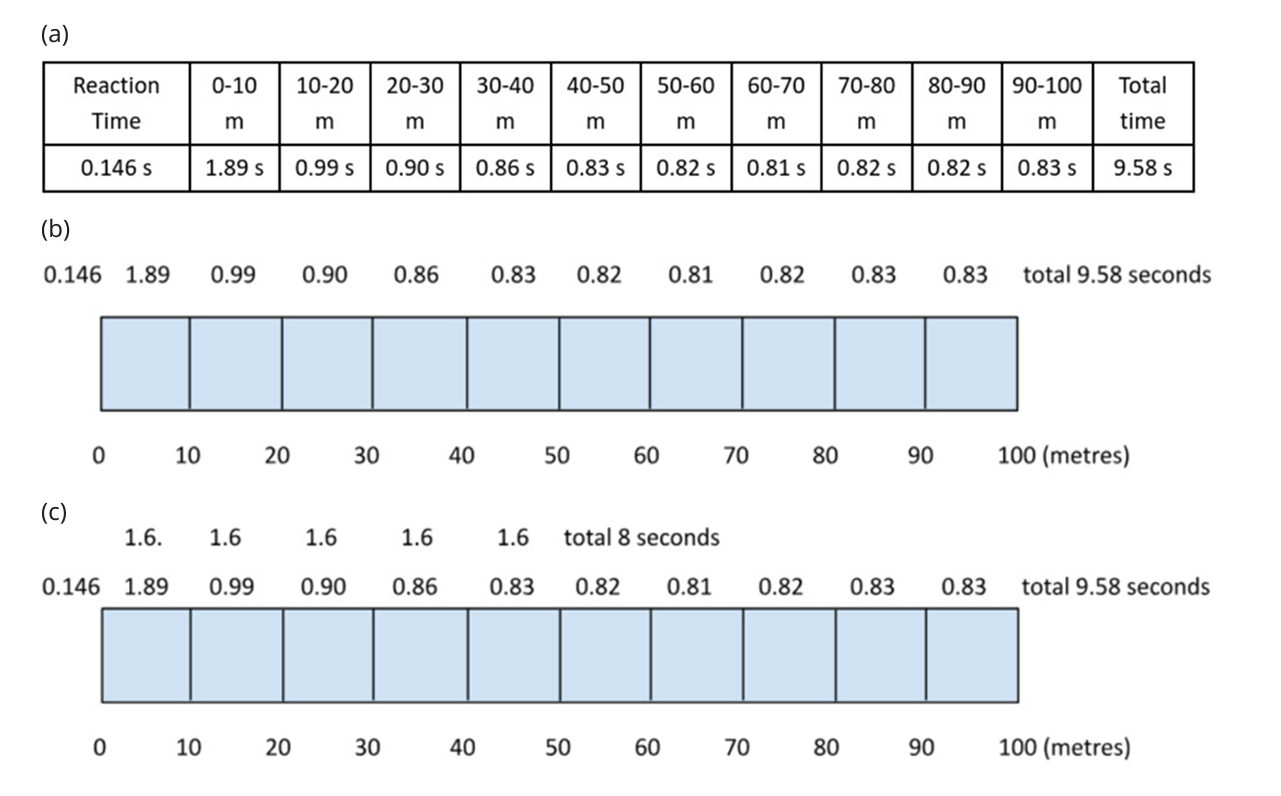
Then, next to Usain Bolt’s data, we wrote down the amount of time their classmates had taken to cover 10-metre splits (see Fig. 2c). We asked our students if they were okay with this. The entire class protested, pointing out that the data was not true. We did not have any of the 10-metre split times for their classmates. We had only measured the total time it took their racing classmates to reach the finish line.
At this point, we introduced the idea of average speed as the total distance covered by a moving object divided by the total time it takes to cover it. To emphasise this point, we explicitly rewrote the earlier calculations for the average speeds of their faster classmate and Usain Bolt as 50 metres divided by 8 seconds and 100 metres divided by 9.58 seconds respectively.
Connecting to everyday units
We now tried to connect the concepts of distance, time, and speed to the students’ everyday understanding of these measurements. According to Google Maps, the distance from the school gate to the main road is 740 m. This was a distance that our students travelled every school day. We calculated Bolt’s top speed: 10 metres/0.81 seconds = 12.3 m/s. Then asked how long it would take for Bolt to cover the distance between the main road and the school gate if he ran at his top speed:
10 m in 0.81 s
740 m in ? s
The students calculated that Bolt would cover this distance in a minute (about 60 seconds). We wrote this number on the board and used it to calculate the distance Bolt would travel in an hour: 740 x 60 = 44500 m = 44.5 kilometres. At this point, we introduced students to the idea that speed is commonly spoken about in units of kilometres per hour (kmph). Bolt’s speed in these units would be 44.5 kmph.
To help them relate to these new units, we compared Bolt’s speed with that of the fastest animals and birds. For example, a cheetah’s top speed is known to be 100 to 120 kmph. We noted that this is more than twice Usain Bolt’s top speed. A student claimed that it was possible for them to run and catch up with a scooter moving at a constant speed of 20 kmph. We asked the class to use the logic we had just used to calculate the average speed of their faster classmate in kmph. In a few minutes, the students shared that it would be 6.25 x 60 x 60 metres per hour = 22.5 kmph. We ended the session by pointing out that by running at this speed, their classmate would indeed be able to catch up with a scooter moving at 20 kmph.
Summing up
We aimed to help our students connect textbook concepts of motion with their life experiences. We were fortunate to work in a school that allows teachers the freedom to come up with novel ways to do this. One of our ideas was to use Usain Bolt’s sprint as an ice- breaker. But this context spoke to so many of our students that we found it helpful to stay with it throughout our exploration of motion. We also wonder if the field of sports may be rich with other such contexts that could be used to help students connect with concepts in science.
The process of addressing the challenge of engaging student interest in concepts related to motion was intense and time- consuming for us. Three things helped us in this process:
- The active participation of our students in each of the activities and discussions: We observed that students made different contributions to the class. Their contributions often sparked off their peers’ thinking processes in ways that helped us sustain a dialogue with them.
- Our experience of co-teaching this topic: Like many teachers, we planned the activities for each class in advance and observed how our students responded to them. This meant that we often changed our plan in real time and moved on to connect things in future classes. Working together allowed us to share ideas and discuss problems with each other. It gave us the confidence to try out new and tentative ideas and offer on-the-spot responses to our students’ questions and ideas. It was also helpful to get a peer’s perspective on how one is interacting with students and how they are responding to the class.
- Documenting our lessons: We recorded our main observations from each class, took photographs of the blackboard, and jotted down points from our process of planning a sequence of successive classes. It helped that we maintained electronic files—we could locate our documentation, share it with each other, and see what themes emerged from them.
To meet the challenge of making science personally relatable and interesting to students, teachers need to have the space and time to learn how to iteratively develop effective and localised ways of engaging students in the subject matter of science. We feel that collaborating with a colleague may be one of the most readily available, accessible, and sustainable forms of support a teacher can get in strengthening their teaching practice.
Key takeaways
- Sports can provide engaging contexts for introducing students to curricular concepts around linear motion and connecting them with tangible experiences of distance, time, and speed.
- A teaching plan that changes to accommodate student responses is crucial in inviting students to share their ideas with each other and in encouraging their active participation in all the activities and discussions.
- Preparing for and facilitating such a pedagogical approach may require a lot of thought and time from teachers. Collaboration with other teachers can be one of the most readily available and sustainable forms of support that teachers can receive in such efforts.
Notes
- Credits for the image used in the background of the article title: Usain Bolt, Tobi 87, Wikimedia Commons. URL: https://en.wikipedia.org/wiki/Usain_Bolt#/ media/File:Leichtathletik_WM_2013_Moskau_100_m_Vorlauf.jpg. License: CC-BY-SA 3.0 Unported Deed.
- For your students to actively participate in this pedagogical approach, they will need to be familiar with concepts like length measurement (Grade II mathematics), decimals to relate to non-integral values of time (Grade V mathematics), and direct proportion (Grade VII mathematics). They should also be able to round off numbers to get estimates.
- If space for a 50-metre race is not available in and around your school, encourage your students to mark off a shorter distance and adapt the activity accordingly. If a 5-metre metal measuring tape is not available in your school, invite students to think of other easily available alternatives (like sticks or a spool of thread) that can be used to measure the distance for the race. You can also get your students to think about and discuss how these changes affect the accuracy of their measurements.
- This article includes one detachable classroom resource: Teacher’s Guide: Suggestions for Teaching Concepts Related to Linear Motion.
References
- National Steering Committee for National Curriculum Frameworks. ‘National Curriculum Framework for School Education 2023’. National Council of Educational Research and Training. URL: https://ncert.nic.in/pdf/NCFSE-2023-August_2023.pdf.
- National Council of Educational Research and Training (2007, 2022). ‘Chapter 5: Measurement of Length and Motion’. Science Textbook for Class VI (Reprint 2024-25): 80-100. URL: https://ncert.nic.in/textbook.php?fecu1=5-12.
- National Council of Educational Research and Training (2007, 2022). ‘Chapter 9: Motion and Time’. Science Textbook for Class VII (Reprint 2024-25): 93-108. URL: https://ncert.nic.in/textbook.php?gesc1=9-13.
- Strogatz, Steven. (2019). ‘Usain Bolt’s Split Times and the Power of Calculus’. Quanta Magazine. Uploaded on April 3, 2019. URL: https://www.quantamagazine. org/infinite-powers-usain-bolt-and-the-art-of-calculus-20190403/.
- Žiga P. Škraba. ‘Usain Bolt 9.58 – 100m World Record [50 fps]’. YouTube. Uploaded on Aug 16, 2015. URL: https://www.youtube.com/watch?v=HFLuduKmnW0.
- National Council of Educational Research and Training. ‘Learning Outcomes at the Elementary Stage’. First Edition. April 2017. National Council of Educational Research and Training, Sri Aurobindo Marg, New Delhi. ISBN 978-93-5007-785-6. URL: https://ncert.nic.in/pdf/publication/otherpublications/tilops101.pdf.
- Jimson Lee. ‘Usain Bolt 10 meter splits, Fastest Top Speed, 2008 vs 2009’. SpeedEndurance.com. Uploaded on Aug 19, 2009. URL: https://speedendurance. com/2009/08/19/usain-bolt-10-meter-splits-fastest-top-speed-2008-vs-2009/.